
Monitoring and Graphs
Check CPU, memory, disk, network and bandwidth usage of your VPS from the control panel.
The control panel shows how your VPS is using its resources, so you can spot a full disk, a busy CPU or unexpected traffic. Open the control panel, click the Manage (cog) icon of your server, and use the Overview and Graphs tabs.
Overview
The Overview tab is a live summary of the server:
| Widget | What it shows |
|---|---|
| Disk Usage | Used and total disk space, with a percentage bar. |
| Bandwidth | Traffic used against the plan limit, split into IN and OUT. |
| CPU Usage | CPU load as a percentage, over time. |
| Network Speed | Current transfer speed, with total, download and upload lines. |
| vCPU / RAM | The CPU cores and memory assigned to the plan. |
| Uptime | How long the server has been running since its last start. |
| Region | Where the server is hosted. |
| Account | Your last login to the panel. |
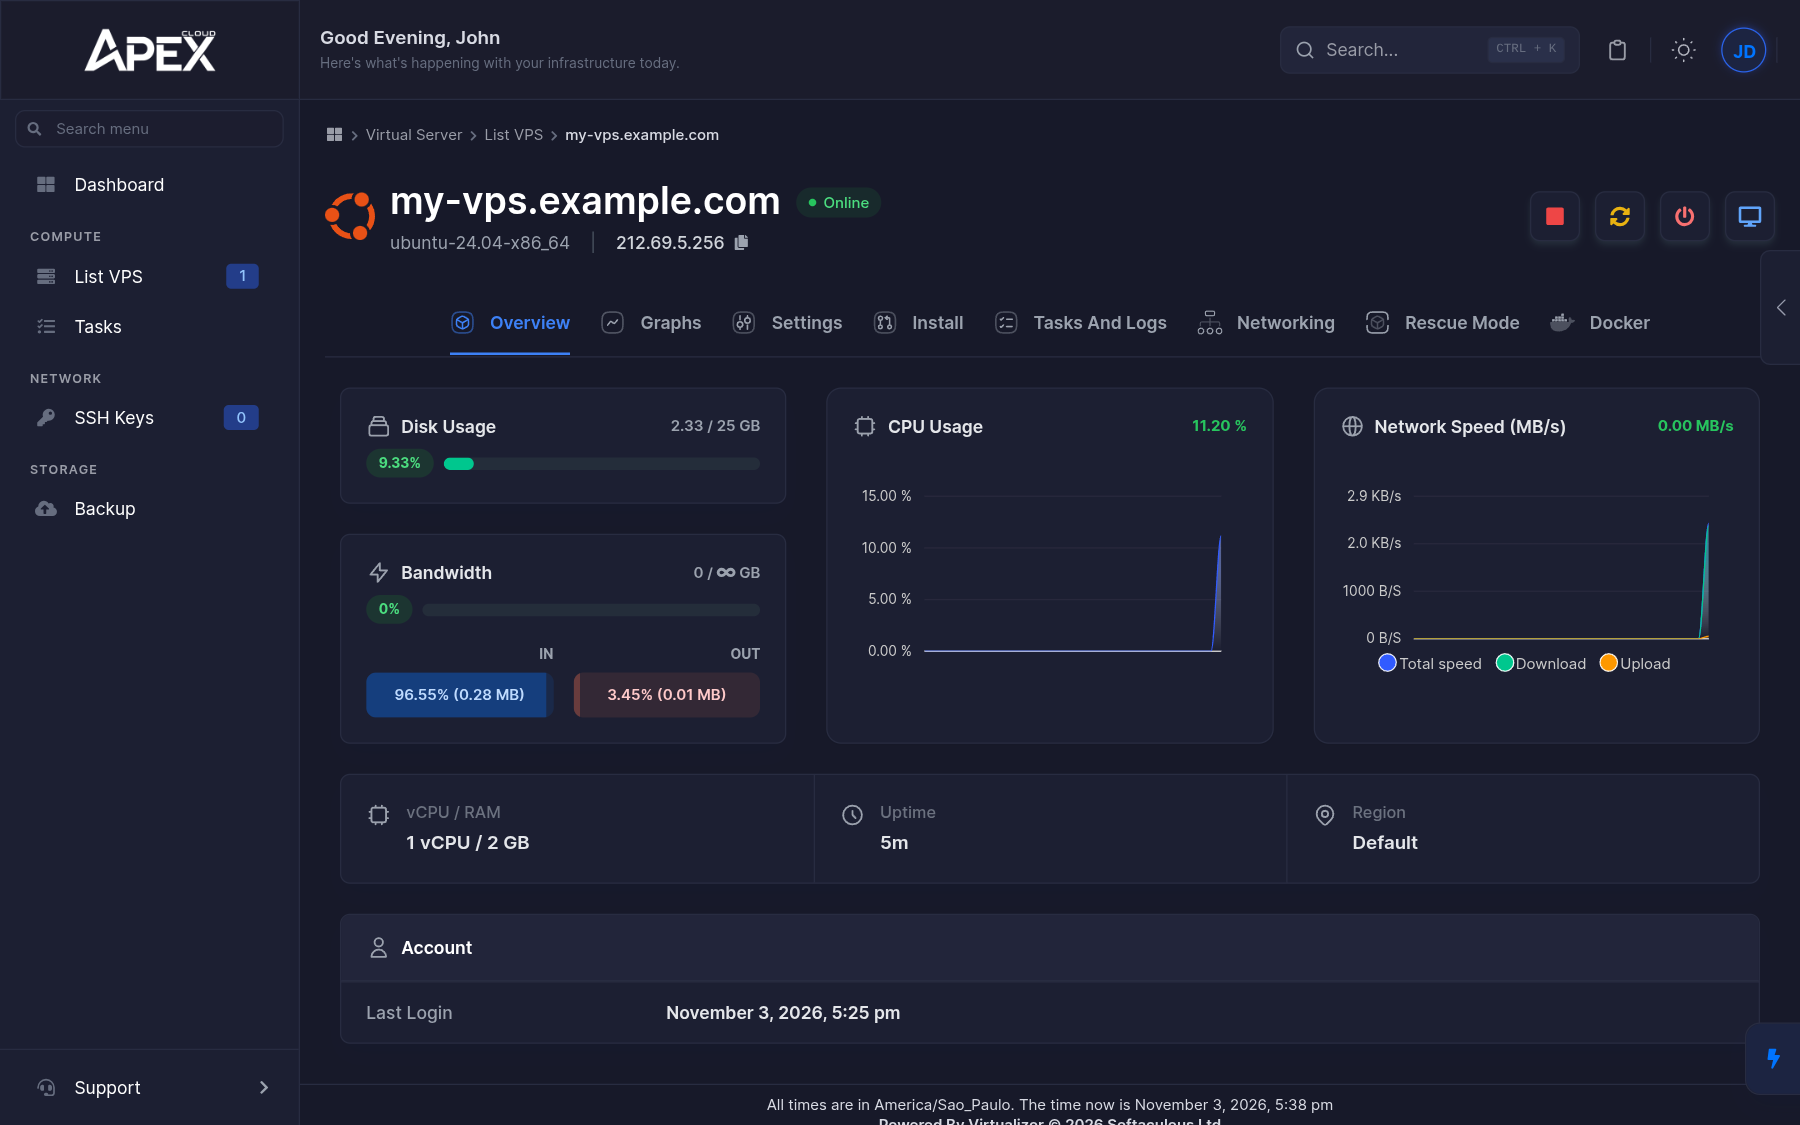
The Dashboard in the sidebar shows the same kind of information summarised across all your servers: running and total VPS, bandwidth used, and a resource overview.
Graphs
The Graphs tab has two sub-tabs.
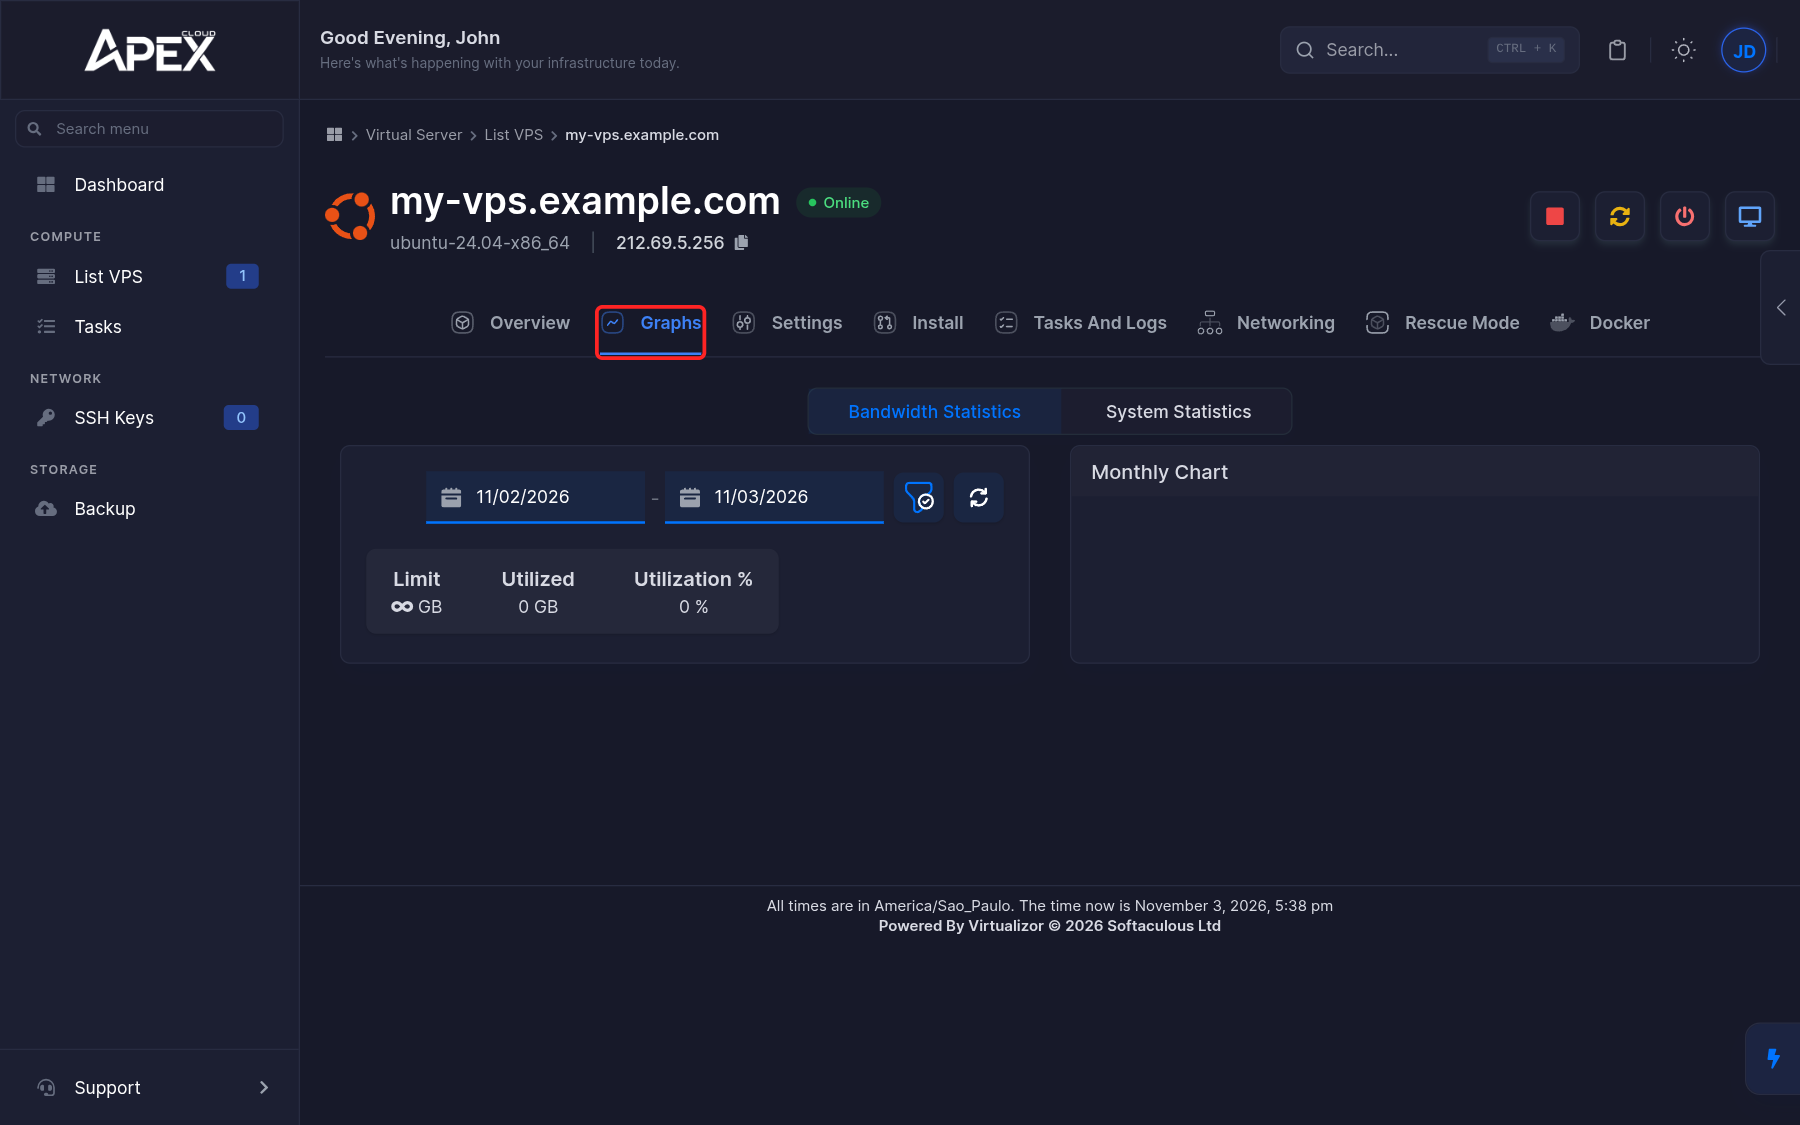
Bandwidth Statistics
Choose a date range to see the bandwidth the server used. The panel shows the Limit, the amount Utilized, the Utilization as a percentage and a Monthly Chart. If the plan has no bandwidth cap, the limit is shown as unlimited. On the test plan used for these docs, the panel showed Unlimited. Check your own server's panel for the value that applies to your plan.
System Statistics
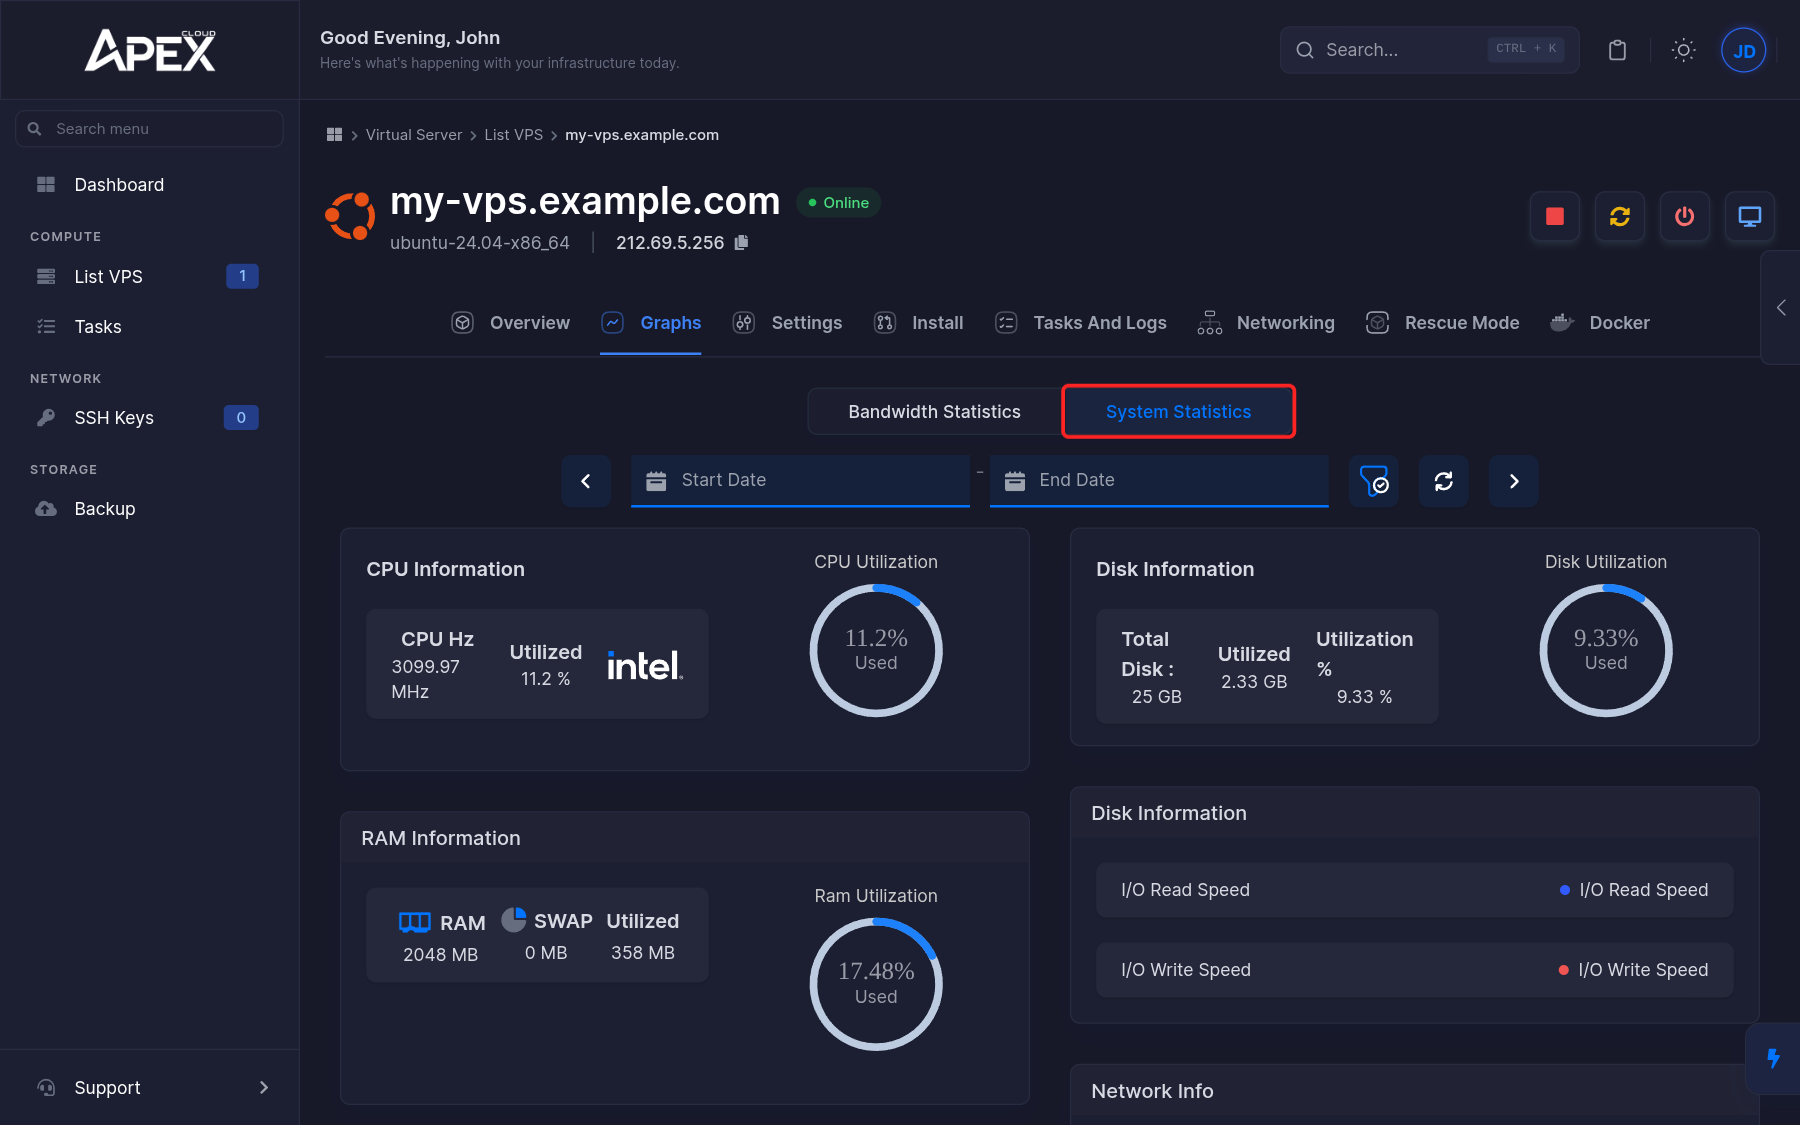
This sub-tab shows detailed charts of how the server is running:
- CPU: speed in MHz and utilization.
- RAM: total, swap and utilized memory.
- Inodes.
- Disk: total and utilized space.
- I/O: read and write speed.
- Network: average download and upload.
For per-process detail, log in to the server and use tools such as htop, df -h and free -h on Linux, or Task Manager on Windows.
Tasks and logs
The Tasks And Logs tab lists every action performed on the server, such as starting, restarting or reinstalling it. It has three sub-tabs, Tasks, Logs and Status logs. The table shows the action ID, the action, its status and its progress.
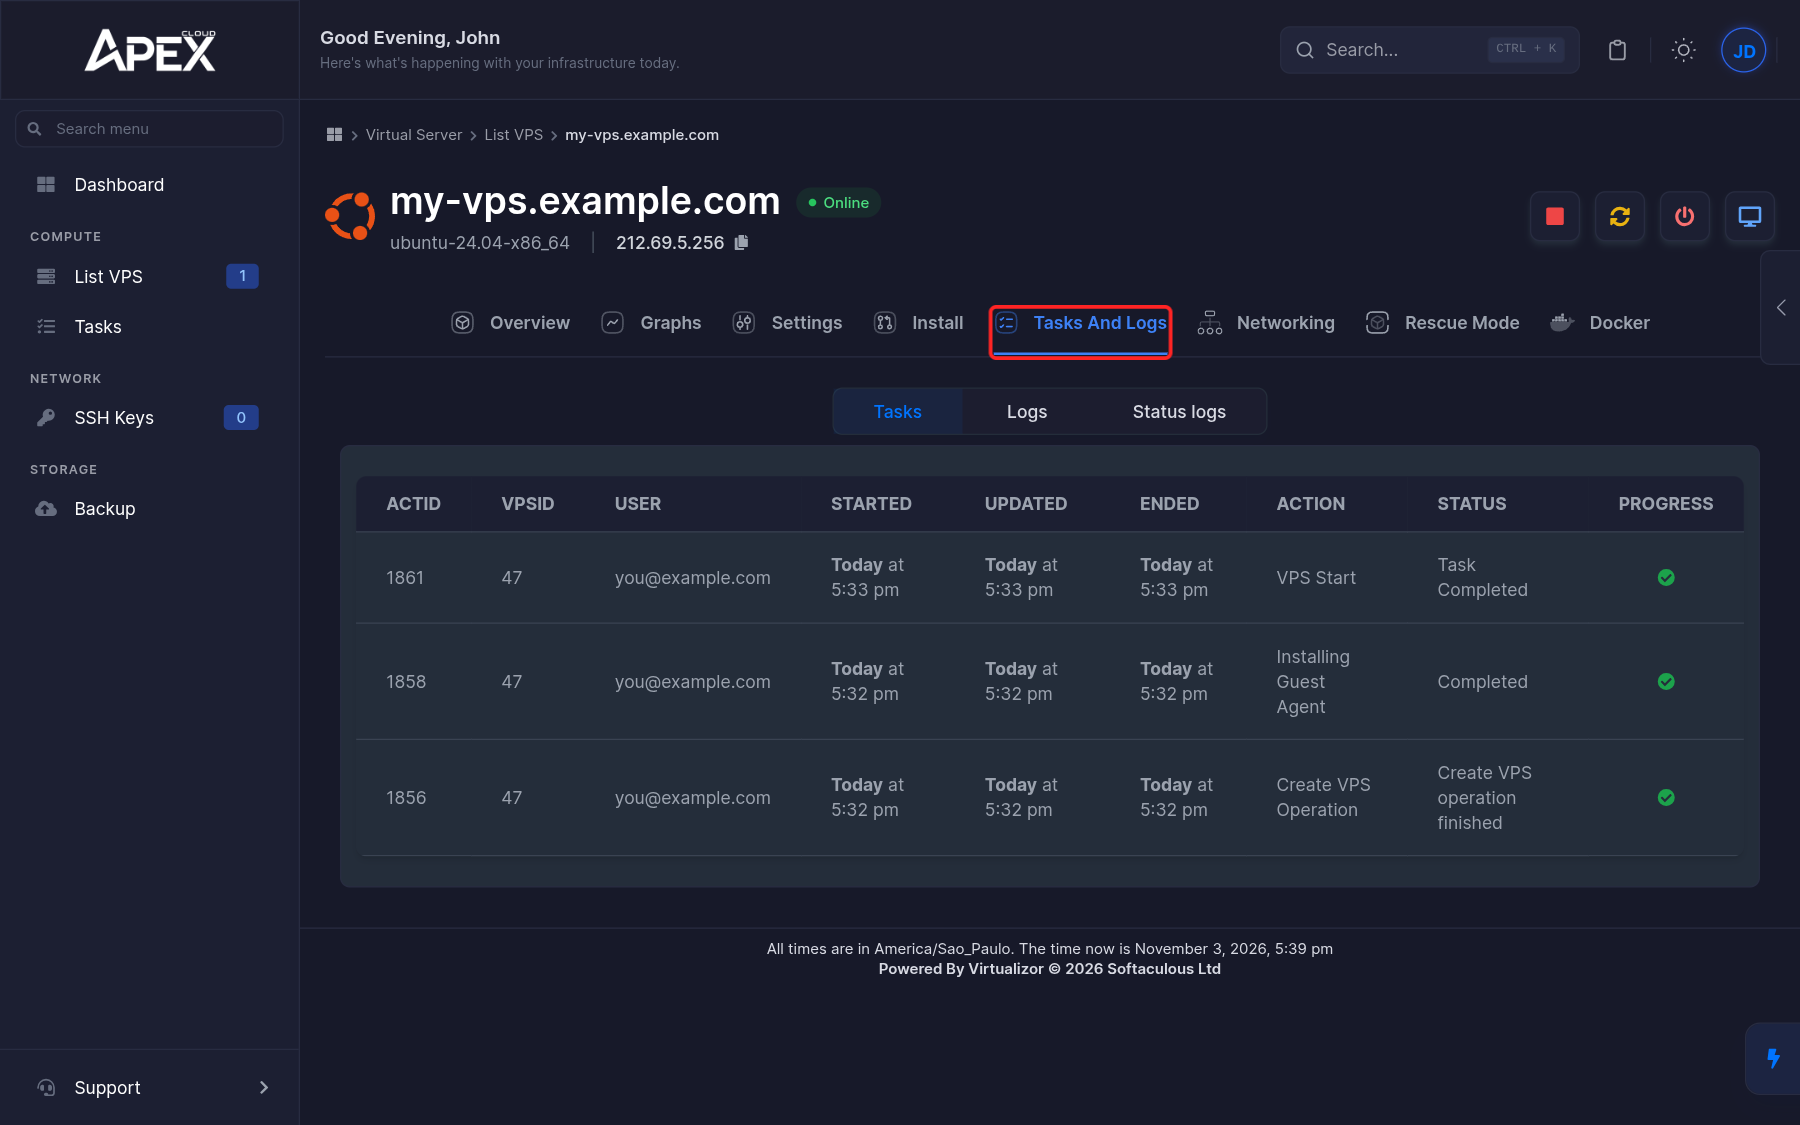
Open it when you want to know whether a restart or a reinstall has finished. A new VPS shows the tasks Create VPS Operation, Installing Guest Agent and VPS Start. The Tasks page in the sidebar lists the tasks of all your servers.
Bandwidth threshold
The panel Account page has a VPS bandwidth threshold under Settings. See Control Panel.
If your server looks slow or unreachable, see Troubleshooting. To check whether there is a problem on Apex Cloud's side, see the status page.